
Welcome back! (if that statement isn’t appropriate you’ll want to check out part 1 first: Gaia star data with D3 – part 1). We are going to make everything look much better, and then do a couple of optimizations.
Let’s make the sky look more natural, i.e. Black. In the current SVG specification there’s no way to set a background colour, so to work around that we’ll place a rectangle across the whole image.
svg.append("rect")
      .attr("width", width )
      .attr("height", height )
      .style("fill", "black")
We just need to append the rect and set its size to the SVG then its colour to black (alternatively we could set the colour using CSS).
Now if you run all the code again you won’t see anything as out stars are black too. Let’s change that, find where we create the circles and add another attr call to it.
svg.selectAll("circle")
      ...
      .style("fill","white")
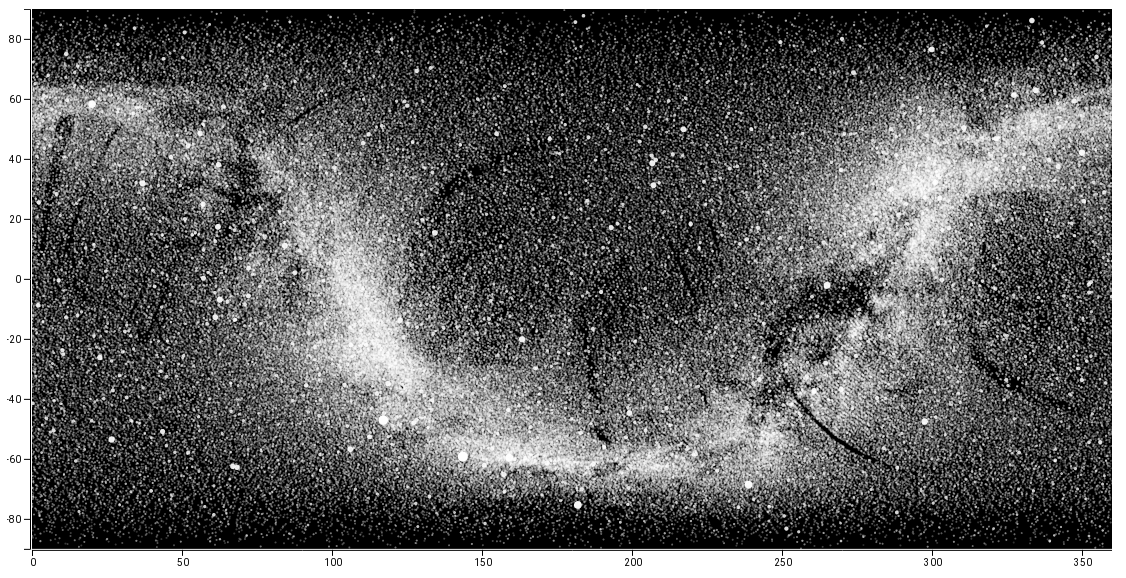
We’ve made the stars white. Things are looking better already. However it’s still not looking very “starry sky” like, mostly because all stars do not shine with an equal brightness, nor at equal distances. So let’s go back to the data. We have another field called _flux_ which is exactly what we need, the apparent brightness of the star as it appears from Earth (as determined by its intrinsic brightness and its distance from us).
Now we have a value we can use to contrast a stars brightness with the others, we just need to decide what to change. One obvious possibility is colour, we could make the brighter stars white and dimmer ones progressively darker.
A simple way to adjust colour is to create an RGB value, which looks like this:
rgb( number, number, number )
We just need another scale to convert the flux to a number up to 255, the maximum colour value. We can do this just like we did with the RA and Dec scales but this time we need to know the maximum and minimum values of flux too:
var fluxDoman = d3.domain( data, function (d) { return d.flux; } )
var fluxScale = d3.scaleLog().domain(fluxDomain).range(100, 255 );
Here we first let D3 find the domain then we pass this into our scale, which then returns a value between 100 and 255. However, here we are using a different type of scale, a log scale, as the flux numbers have such a large variation a linear scale would mean most of the stars would appear very dim.
Now we need to adjust the colour of a star depending on its flux:
svg.selectAll("circle")
      ...
      .style("fill",function(d) {
          var colour = Math.ceil( fluxScale(d.flux) );
          return "rgb(" + colour + "," + colour + "," + colour + ")";
      } )
We need to make sure it’s a whole number, that’s what Math.ceil does. Now we determine a colour e.g. rgb(200,200,200) based on the flux of the star. That all looks good…
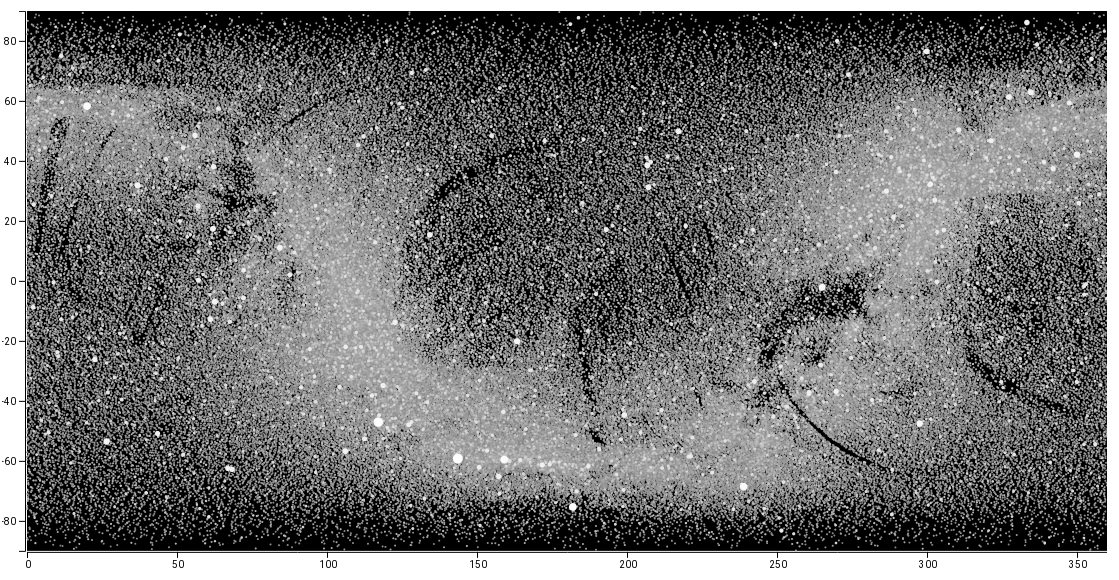
…apart from one horrible problem. Now we have a situation where dim stars look dirty, but worse still, multiple stars close together appear dimmer when in a reality two combined light sources should appear brighter! This effect gets worse the more stars are added. Back to the drawing board…
Luckily there is a really simple way to both dim distant single stars and intensify distant groups of stars. We can use opacity which is a measure of how transparent something is. Single stars will blend with the black background while multiple stars will blend with the background but also blend with each other!
So lets change the code. Opacity has a value from 0 to 1 , with 0 meaning completely transparent.
var fluxScale = d3.scaleLog().domain(fluxDomain).range(0.1, 1 );
We just change the range here, everything else is the same. The opacity values will range from 0.1 to 1 as we don’t want any stars to be completely invisible! We can play with those values later. Now we’ll just update the stars fill and opacity:
svg.selectAll("circle")
      ...
      .style("fill","white")
      .style("opacity", function(d) {
          return fluxScale(d.flux) +"";
      } )
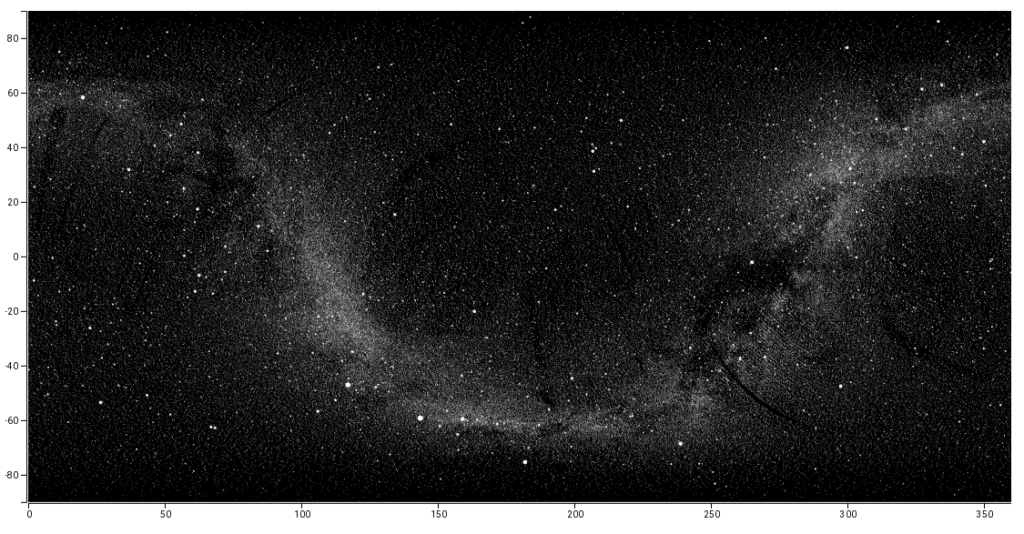
Now that is looking really awesome.
But one more little tweak to make, I’m going to change the radius slightly of the brightest stars, this is to approximate how bright stars can appear larger than points of light because of the way the light is recorded by light sensors ( our eyes or cameras). We’ll need another scale:
var fluxRadiusScale = d3.scaleLinear().domain(fluxDomain).range(0.5, 3);
We’ve gone back to a linear scale as I only want the very brightest stars to be affected by this. Now we adjust the radius:
svg.selectAll("circle")
      ...
      .attr("radius", function(d) {
          return fluxRadiusScale(d.flux);
      })
Great! But we’ve just introduced a potential bug. The stars have no order so the brightest stars can appear anywhere in the list. This means that our bright large stars can have smaller stars drawn over the top. Luckily it isn’t noticeable right now as the stars are the same colour, but if we change that in the future it’ll start to look strange. But this is simple to fix, we’ll just create an order:
data = d3.sort(data, function (d1,d2) { return d1.flux - d2.flux; } )
Incidentally, now we have order the data by flux, we can get the flux domain by selected the first and last item in data:
var fluxDoman = [ data[0], data[data.length-1] ];
I’m pretty happy with how it looks now but D3’s primary benefit is in interactivity and we have none. In part this is to do with the ability of browsers to cope with an extreme number of elements (the SVG circles here), however it’s not a problem with the elements themselves – browsers are great at showing large SVGs – the problem is with JavaScript, its events and timers, there’s just to many of them, especially if we try to use D3’s animation functions (transition, delay, duration). The good news is there’s one really simple way to disable all the mouse events for our objects we just need to add a CSS style:
append("circle")
    ...
    .style("pointer-events","none")
It’s quite remarkable the difference it makes, particularly when interacting with the mouse. One other thing we can do is reduce the size of the data by switching our objects to arrays, from:
{ ra: 123, dec: 50, flux: 10000 }
to
[123, 50, 10000]
It’s the same data just accessed differently (d[0] instead of d.ra). This also has a speed improvement.
So that concludes the tutorial. I hope you like the results but also go forward and play with the data yourself. You could try using the other co-ordinate system in the data, or combine it with other datasets, for instance to find a stars intrinsic colour. Click on the image at the top of this post to see a live version (I’ve tweaked some of the opacity, and sizes to improve the overall look 😉 )
Check out the full code here: https://bitbucket.org/akademy/gaiavis/src/41cbd4d351dae818a5549539959b680f9192fee3/stars_better.html?at=master&fileviewer=file-view-default
Enjoy
One Reply to “Gaia star data with D3 – part 2 – prettier, faster”